Define which pump failures need a response
Pump monitoring works best when it combines physical signatures—flow, current, pressure, vibration or usage—with operational context. A zero-flow value is not a fault if there was no demand or scheduled run. Conversely, a healthy radio connection does not prove the pump is delivering service. Build a state model that includes expected operation, measured operation, device health and response status.
Start by writing the operational question in one sentence: Which observable pattern is specific enough to trigger inspection, and what service metric shows the alert improved uptime? Then define who will act, how quickly they must act, and what independent evidence will confirm that the action worked. A reading that cannot change a decision may still be useful for research, but it should not be confused with an operational alert. For remote pump monitoring, the most common design error is to instrument the measurable variable before agreeing on the service decision it is meant to improve.
Translate pump states into diagnostic rules
Model expected state as well as measured state
Model expected state as well as measured state. A fault is often the difference between what should happen and what did happen. Join schedule, demand proxy or control command with current/flow/pressure evidence. This makes the decision inspectable: another operator can see what condition triggered the choice, what evidence should be recorded, and what would cause the choice to be revisited.
Require persistence for noisy signatures
Require persistence for noisy signatures. Single vibration/current spikes can create alarm fatigue. Use a time window or consecutive samples after inspecting raw normal/fault data. This makes the decision inspectable: another operator can see what condition triggered the choice, what evidence should be recorded, and what would cause the choice to be revisited.
Route by fault class
Route by fault class. Electrical, hydraulic, telemetry and usage anomalies need different skills and spares. Map each alert class to a diagnostic checklist before dispatch. This makes the decision inspectable: another operator can see what condition triggered the choice, what evidence should be recorded, and what would cause the choice to be revisited.
Measure repair outcome, not alert volume
Measure repair outcome, not alert volume. A higher count of alerts can mean worse thresholds rather than better operations. Track detection-to-acknowledgement, acknowledgement-to-dispatch and dispatch-to-verified-restoration separately. This makes the decision inspectable: another operator can see what condition triggered the choice, what evidence should be recorded, and what would cause the choice to be revisited.
Record the electrical and hydraulic baseline
A field design is only reproducible when the variables behind it are visible. The table below is a minimum record for remote pump monitoring. Do not replace unknowns with optimistic defaults. Mark them unknown, collect the missing observation during the pilot, and record the date and method used to resolve them.
For each pump, record motor rating, normal current range, expected runtime pattern, pressure/flow behavior, controller state, duty cycle and the operating context that changes those values. Baselines should be tied to the same pump configuration so a motor replacement or valve change does not silently invalidate the alert logic.
| Variable | Record | Why it matters |
|---|---|---|
| Expected operation | schedule/demand/control state | Defines when non-operation is abnormal. |
| Motor current/power | A or W/kW | Separates electrical load states. |
| Flow/pressure | rate / pressure | Confirms hydraulic service. |
| Persistence | samples or minutes | Controls nuisance alerts. |
| Response SLA | minutes/hours/days | Connects detection to operations. |
| Closure evidence | flow/current/field check | Prevents premature ticket closure. |
Diagnose the pump before sending a technician
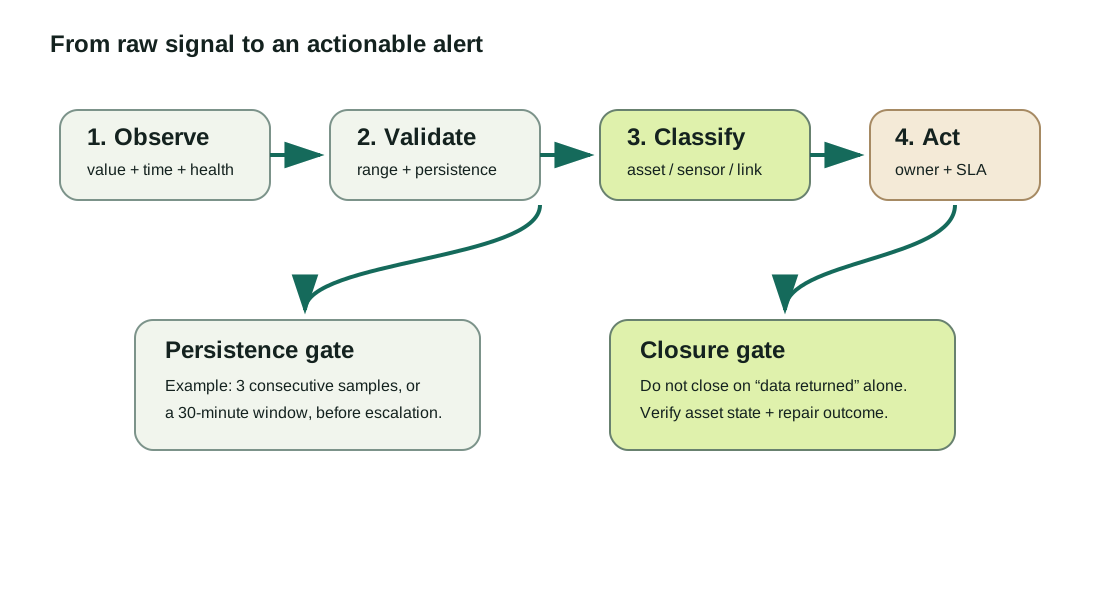
Remote monitoring collapses several failure domains into one screen. A flat line, a missing packet and a real infrastructure fault can look similar if the telemetry does not expose device health. For remote pump monitoring, use the sequence below before assigning a repair crew. The purpose is not to delay urgent response; it is to prevent a communications or sensor fault from being mislabeled as an asset failure.
A current alarm alone is not a diagnosis. Compare commanded state with current, flow and pressure: current with no hydraulic response can indicate dry running, lost prime, blockage or a hydraulic sensor issue; flow with no current signature can point to a current-sensor problem or another water source.
| Observed pattern | Likely checks | Next action |
|---|---|---|
| Current on, no flow | dry run, blocked line, closed valve, sensor fault | Protect equipment and inspect hydraulic path. |
| No current when expected | power supply, controller, protection trip, motor | Check power/control before mechanical work. |
| Usage signal disappears, health normal | real non-use, disconnected sensor, mechanical issue | Compare secondary signature and local context. |
| All telemetry missing | power/radio/backend | Diagnose device/network before pump fault classification. |
Commission known pump states and fault evidence
Commission by exercising known states: pump off, normal run, start/stop transition and—where safe—a controlled condition that should trigger the chosen alert. Record the current/pressure/flow traces for each state so future technicians have a reference signature rather than only a threshold number.
For remote pump monitoring, complete the following steps in order. If a step fails, correct it before treating later successful steps as proof of readiness. A cloud dashboard receiving one packet is not enough if the sensor reference, timestamp, power behavior or alert route is still unverified.
- Capture a normal operating cycle and at least one safe known-off state for baseline comparison.
- Verify current/flow/pressure sensors against available references and record units/scaling.
- Trigger a non-emergency simulated condition permitted by the operating procedure.
- Confirm persistence logic avoids a ticket for a single transient but escalates the sustained test.
- Verify the ticket routes to the correct role with fault class and diagnostic context.
- Close only after defined service-restoration evidence is visible.
Measure detection quality and repair outcome
Acceptance should measure fault detection and repair workflow, not message volume. Define which failure classes must be detected, maximum acceptable alert delay, false-dispatch tolerance, required corroborating signal and how the system confirms that the repair restored normal hydraulic performance.
Set persistence and deviation thresholds from observed operating cycles. A borehole pump with stable duty may support narrow bands, while a variable-demand booster needs wider state-dependent limits. Revisit thresholds after motor, pump, controller or valve changes because those interventions can shift the normal signature.
- State separation — Dashboard/report distinguishes expected-off, unexpected-off and telemetry-loss states.
- Alert specificity — Test fault maps to the intended diagnostic class.
- Latency — Sustained test reaches the responsible role inside the service window.
- Evidence — Raw signature around the event can be inspected after the fact.
- Closure — Service restoration is verified with the chosen evidence.
- Metric — Time-to-repair can be calculated from consistent event/ticket timestamps.
Worked example
Scenario. A fleet has 80 pumps, historically 0.8 reportable failures per pump-year and an average 12-day outage. A response service targets 4 days.
Calculation or rule. Expected failures = 80 × 0.8 = 64/year. If the target is achieved, avoided pump-outage days = 64 × (12 − 4) = 512 pump-days/year.
Interpretation. This is an operational exposure metric, not a valuation. Use observed local failure rates and compare before/after distributions rather than assuming the target will be achieved. The example is intentionally transparent so the inputs can be replaced with local values rather than copied as a universal recommendation.
What pump-monitoring deployments show about repair response
Oxford’s review of rural water monitoring reports Kenyan trials in which average days-to-repair fell from 27 days before the trial to 2 days for pumps with automated data in one study, with a second study reporting less than 3 days from a 37-day pretrial average. The result paired monitoring with an organized repair service.
The field evidence supports monitoring-plus-response, not sensing in isolation. It also suggests that repair-time distribution is a more meaningful programme metric than the number of alerts sent. Published deployment evidence is useful here as a design constraint, not as a promise that another programme will achieve the same result. Geography, spare-parts logistics, institutional incentives, staffing and connectivity all change outcomes.
Review baselines after motor, controller or hydraulic work
Do not freeze the configuration after launch. Review remote pump monitoring after the first meaningful operating period, after any firmware/network change, and whenever false alarms, unexplained data gaps or missed failures appear. The review should compare the original decision requirement with actual response times and data quality, then change only one major rule at a time when possible so the effect can be observed.
Keep a maintenance history for motor changes, current-clamp repositioning, pressure-sensor service, flow-meter work, controller settings and valve changes. Those events can shift the electrical-to-hydraulic relationship and should be visible when an alert pattern changes.
- Review top false-alarm classes and adjust only with raw-event evidence.
- Track sensor mounting/scale changes beside pump maintenance.
- Audit tickets that closed without restoration evidence.
- Recalculate failure and repair-time baselines on a fixed reporting period.
Sources and limits
Use these references to verify the underlying guidance. Local regulations, operator coverage and manufacturer instructions can change the correct implementation.
- Oxford: Remote monitoring of rural water systems reviewThe review reports field studies where automated pump data combined with a repair service reduced average repair times dramatically, illustrating that sensing only creates value when linked to response.
- UNICEF Smart PumpsUNICEF describes remote sensors and mobile technology used to monitor handpump use and functionality and to support earlier detection of failures.
- World Bank, World Development Report 2021 data exampleThe WDR evidence base includes Kenyan handpump monitoring examples in which repair time fell markedly when operational data became actionable.
- FAO sourcebook: solar energy in irrigated agriculture (2022)FAO covers design, operation, inspection, troubleshooting and maintenance of solar photovoltaic pumping systems.
- NISTIR 8259A IoT Device Cybersecurity Capability Core BaselineNIST identifies core capabilities such as device identification, controlled configuration, data protection, interface access control and secure software update.
Procurement questions for pump fault visibility
For pump monitoring, ask whether the supplier can ingest or measure the signals that actually discriminate faults at your sites—commanded state, current, flow, pressure, controller status—and how those channels are synchronized. Also ask how field technicians replace clamps or sensors without losing the alert baseline.
Confirm sensor ranges, electrical isolation, controller compatibility, sampling speed, local buffering, event timestamps and data export for the exact pump/controller configuration. If fault analytics are proprietary, require visibility into the measurements behind each alarm so maintenance teams can verify the diagnosis.
- Can configuration, raw readings and quality flags be exported in a documented format without a proprietary dashboard?
- How are device identity, credentials, configuration authorization and software updates handled over the supported lifetime?
- What is the replacement/calibration process, and what happens to historical data when a device is swapped?
- Which network bands, roaming profiles or gateway requirements have been validated in the target countries?
- What evidence shows the claimed battery life under the intended reporting interval and weak-signal conditions?
- How are queued readings timestamped and de-duplicated after a communications outage?