Define the drought response before choosing indicators
Drought is visible at several scales. Climate and satellite products can show broad wetness or storage anomalies; groundwater wells show local aquifer response; borehole/pump telemetry shows whether infrastructure is continuing to deliver service. Combining them is useful only if their scales are kept explicit. A regional GRACE-derived indicator cannot diagnose one borehole, while one borehole cannot characterize a basin.
Start by writing the operational question in one sentence: Which early signal changes preparedness, and which local measurement confirms that a specific water source is under stress? Then define who will act, how quickly they must act, and what independent evidence will confirm that the action worked. A reading that cannot change a decision may still be useful for research, but it should not be confused with an operational alert. For drought resilience monitoring, the most common design error is to instrument the measurable variable before agreeing on the service decision it is meant to improve.
Build drought triggers in layers
Layer indicators by scale
Layer indicators by scale. Regional, aquifer and service indicators answer different questions. Label spatial scale and intended decision on every dashboard component. This makes the decision inspectable: another operator can see what condition triggered the choice, what evidence should be recorded, and what would cause the choice to be revisited.
Use triggers with confirmation steps
Use triggers with confirmation steps. A single noisy indicator can cause premature restriction or dispatch. Define an early-warning trigger, a local confirmation and the action that follows. This makes the decision inspectable: another operator can see what condition triggered the choice, what evidence should be recorded, and what would cause the choice to be revisited.
Protect groundwater when pumping becomes easier
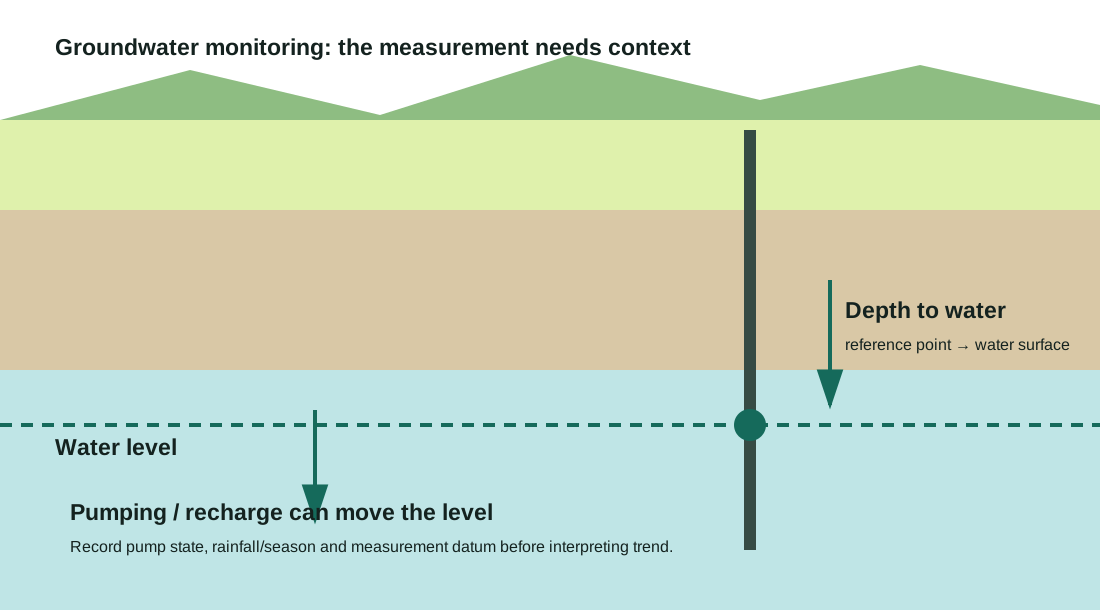
Protect groundwater when pumping becomes easier. Efficient or solar pumping can reduce energy constraints while abstraction pressure remains. Monitor water level/abstraction context alongside pump uptime or energy. This makes the decision inspectable: another operator can see what condition triggered the choice, what evidence should be recorded, and what would cause the choice to be revisited.
Track service continuity separately
Track service continuity separately. Hydrologic drought and service failure can occur together or independently. Maintain uptime/availability metrics so infrastructure weakness is not misclassified as climate stress. This makes the decision inspectable: another operator can see what condition triggered the choice, what evidence should be recorded, and what would cause the choice to be revisited.
Record the baseline behind every drought signal
A field design is only reproducible when the variables behind it are visible. The table below is a minimum record for drought resilience monitoring. Do not replace unknowns with optimistic defaults. Mark them unknown, collect the missing observation during the pilot, and record the date and method used to resolve them.
Keep drought indicators in their native units and scales: rainfall or precipitation anomaly, groundwater depth, storage level, pump runtime, abstraction volume and service interruptions. Record the baseline period used for anomalies so a future analyst can reproduce the trigger rather than inheriting an unexplained red/amber/green label.
| Variable | Record | Why it matters |
|---|---|---|
| Regional drought indicator | percentile/anomaly + spatial resolution | Provides broad context, not site diagnosis. |
| Well level | depth/elevation + datum | Shows local aquifer response. |
| Pumping/abstraction | runtime/flow/volume proxy | Explains demand-related drawdown. |
| Service availability | uptime/flow/access proxy | Shows user-facing continuity. |
| Trigger level | defined condition | Creates repeatable escalation. |
| Confirmation | second indicator/field check | Controls false escalation. |
Separate water stress from ordinary infrastructure failure
Remote monitoring collapses several failure domains into one screen. A flat line, a missing packet and a real infrastructure fault can look similar if the telemetry does not expose device health. For drought resilience monitoring, use the sequence below before assigning a repair crew. The purpose is not to delay urgent response; it is to prevent a communications or sensor fault from being mislabeled as an asset failure.
Before escalating a drought signal, separate regional stress from local infrastructure failure. Compare rainfall or climate indicators with groundwater response, reservoir or tank state, pump availability and recent telemetry health. A dry tank during normal groundwater conditions may be an asset problem, not evidence of aquifer stress.
| Observed pattern | Likely checks | Next action |
|---|---|---|
| Regional indicator dry, local well stable | spatial heterogeneity, lag, aquifer buffering | Continue local trend watch; do not infer site failure. |
| Well falls, regional signal normal | local pumping, local recharge deficit, sensor/datum issue | Check pumping/context and reference measurement. |
| Pump downtime rises, well stable | mechanical/power/network/service issue | Treat as infrastructure response problem. |
| Well and regional indicators fall together | broader drought stress plausible | Escalate according to predefined water-management plan. |
Commission climate, aquifer and asset signals together
Commission the drought view by proving each layer independently: climate feed, local water-level sensor, pump or flow evidence, storage measurement and alert routing. Save one normal and one deliberately simulated abnormal condition so operators know what the dashboard and alert trail should look like when each layer changes.
For drought resilience monitoring, complete the following steps in order. If a step fails, correct it before treating later successful steps as proof of readiness. A cloud dashboard receiving one packet is not enough if the sensor reference, timestamp, power behavior or alert route is still unverified.
- Define the geographic decision unit and list the indicators available at regional, aquifer and service scales.
- Document unit, datum, spatial resolution and update interval for each indicator.
- Back-test proposed triggers against known wet/dry or high/low-demand periods where data exist.
- Specify a confirmation step for each escalation level before operational deployment.
- Run a tabletop exercise: identify who receives the trigger, what action is authorized and what evidence closes it.
- Review triggers after each season and retain configuration history.
Test whether the network distinguishes drought from outages
Acceptance should test whether the network distinguishes drought from ordinary outages. Use a period containing real operating variability, then verify that stale sensors, pump failures and communications gaps are labelled separately from declining groundwater or storage. A useful pilot ends with a response owner for each trigger class.
Trigger levels should map to an operational decision, such as increasing manual verification, restricting abstraction or activating an alternate source. If no regulation defines the threshold, document the baseline, persistence period and confirmation evidence required before the action is taken, then review the rule after a full seasonal cycle.
- Scale — Every indicator visibly states spatial/temporal scale.
- Traceability — Source, update date and processing method are retained.
- Confirmation — High-impact actions require the defined confirmatory evidence.
- Local context — Well datum and pumping state are available for local interpretation.
- Service view — Infrastructure uptime/availability is not conflated with hydrology.
- Governance — Trigger owner and authorized response are documented.
Worked example
Scenario. A regional drought percentile worsens while one production well drops 1.2 m over six weeks and pumping hours rise 25%.
Calculation or rule. The regional signal establishes context; the well trend supplies local evidence; increased pumping is a confounder that must be separated before attributing the full 1.2 m change to drought. Compare with nearby observation wells and recovery periods where available.
Interpretation. Escalation can be justified as a need for closer groundwater management even before assigning a single cause to the decline. The example is intentionally transparent so the inputs can be replaced with local values rather than copied as a universal recommendation.
What field deployments reveal about drought monitoring
NASA GRACE/GRACE-FO products provide broad groundwater and soil-moisture drought indicators, while USGS monitoring practice emphasizes observation-well context and objective-driven frequency. FAO’s irrigation guidance highlights that water management remains necessary when pumping technology reduces energy constraints.
The most robust drought view triangulates independent layers instead of stretching one signal beyond its resolution. Published deployment evidence is useful here as a design constraint, not as a promise that another programme will achieve the same result. Geography, spare-parts logistics, institutional incentives, staffing and connectivity all change outcomes.
Review triggers after seasons and operating changes
Do not freeze the configuration after launch. Review drought resilience monitoring after the first meaningful operating period, after any firmware/network change, and whenever false alarms, unexplained data gaps or missed failures appear. The review should compare the original decision requirement with actual response times and data quality, then change only one major rule at a time when possible so the effect can be observed.
Maintain a record of changes to drought baselines, groundwater trigger depths, abstraction assumptions, pump availability rules and climate data sources. Otherwise a changed dashboard status can reflect a configuration update rather than worsening water stress, making year-to-year comparisons unreliable.
- Archive the exact regional product/version used for each decision.
- Recheck well reference measurements and pumping context during stress periods.
- Review trigger performance after wet and dry seasons.
- Keep response actions and outcomes beside the indicator history.
Sources and limits
Use these references to verify the underlying guidance. Local regulations, operator coverage and manufacturer instructions can change the correct implementation.
- NASA GRACE/GRACE-FO drought monitoringNASA describes GRACE-derived groundwater and soil-moisture indicators for broad drought context; these are regional indicators, not substitutes for a local well measurement.
- USGS: Ground-Water-Level Measurements — Why Frequency MattersUSGS says measurement frequency should be chosen from the monitoring objective and be sufficient to separate short-term and long-term hydrologic effects.
- USGS Climate Response NetworkUSGS describes groundwater observations ranging from periodic manual readings to continuous 15–60 minute sensing, with site-selection controls for climate response.
- FAO irrigation and agricultural water managementFAO notes the water-management implications of irrigation technology, including the need to manage abstraction rather than treating energy availability as the only constraint.
- WHO/UNICEF WASH systems monitoring framework (2026)WHO and UNICEF describe a common framework for monitoring the strength of systems that sustain WASH services.
Procurement questions for multi-layer drought monitoring
For drought monitoring, score vendors on the complete evidence chain: groundwater or storage measurement, pump/abstraction context, data export, stale-data detection and the ability to combine regional feeds with local infrastructure status. Avoid systems that reduce every condition to one proprietary dashboard score.
Confirm how the proposed configuration handles long outages, remote firmware changes, local buffering, multiple sensor types and raw-data export. Ask how thresholds and baselines are versioned so a drought status change can be audited later rather than accepted as an unexplained software result.
- Can configuration, raw readings and quality flags be exported in a documented format without a proprietary dashboard?
- How are device identity, credentials, configuration authorization and software updates handled over the supported lifetime?
- What is the replacement/calibration process, and what happens to historical data when a device is swapped?
- Which network bands, roaming profiles or gateway requirements have been validated in the target countries?
- What evidence shows the claimed battery life under the intended reporting interval and weak-signal conditions?
- How are queued readings timestamped and de-duplicated after a communications outage?